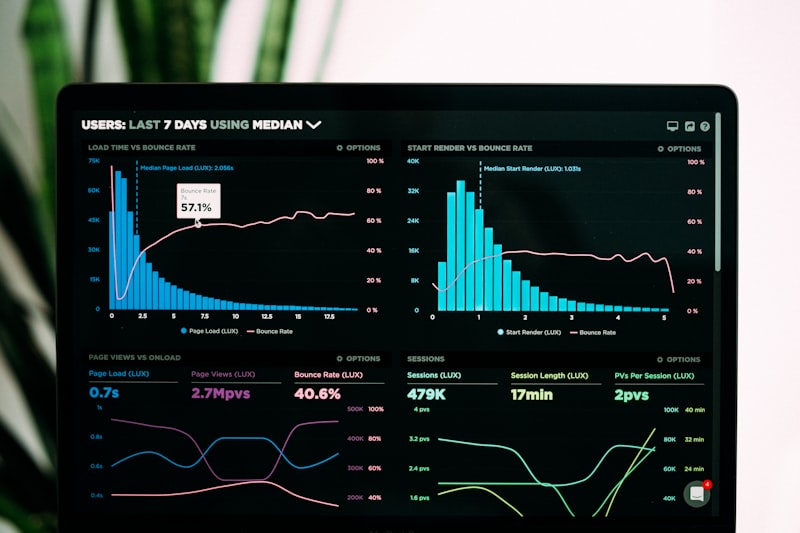
Your Dashboard is Probably Useless
I've walked into dozens of Indonesian companies and seen the same thing: a big screen on the wall showing colorful charts that nobody actually looks at.
The data is there. The charts are there. But the insights? The actionable intelligence? Nowhere to be found.
The problem isn't the technology. It's that most dashboards show you what happened, not what you should do about it. That's where AI changes the game.
From Reporting to Intelligence
A traditional dashboard is passive. It waits for you to look at it and interpret the data. An AI-powered dashboard is active — it watches the data 24/7 and tells you when something needs attention.
Here's the difference:
- Traditional: "Sales are down 15% this month" (you see this when you open the dashboard)
- AI-powered: "Sales dropped 15% mainly in the East Java region due to delayed shipments from Supplier X. Recommendation: Contact Supplier X or activate backup supplier Y." (you get this as an alert)
The Architecture That Works
Here's the stack I use for AI-powered dashboards in Indonesian businesses:
- Data layer: PostgreSQL + Redis for caching (cheap, reliable, runs great on a Rp 500K/month VPS)
- Processing layer: Go services for data aggregation and real-time processing
- AI layer: LLM integration for natural language insights and anomaly detection
- Frontend: React with Recharts or Apache ECharts for visualization
The key insight: don't try to build everything from scratch. Use proven tools for visualization and focus your AI on the intelligence layer.
Real Example: Distribution Company Dashboard
Here's what I built for a distribution company in Semarang:
// AI insight engine for sales data
func GenerateInsights(ctx context.Context, data SalesData) []Insight {
    insights := []Insight{}

    // Anomaly detection
    for _, metric := range data.Metrics {
        if metric.Deviation > 2.0 {
            insights = append(insights, Insight{
                Type:      "anomaly",
                Severity:  "warning",
                Message:   fmt.Sprintf("%s deviated %.1f%% from expected", metric.Name, metric.Deviation*100),
                Action:    generateRecommendation(ctx, metric),
                Timestamp: time.Now(),
            })
        }
    }

    // Trend analysis
    trends := analyzeTrends(data.History)
    for _, trend := range trends {
        if trend.Confidence > 0.85 {
            insights = append(insights, Insight{
                Type:     "prediction",
                Message:  fmt.Sprintf("%s projected to %s by %.0f%% next week", trend.Metric, trend.Direction, trend.Magnitude),
                Action:   trend.RecommendedAction,
            })
        }
    }

    return insights
}
The dashboard showed three things that the old Excel-based reporting missed:
- A supplier was consistently late on deliveries — costing Rp 12 juta per month in lost sales
- One product category was growing at 23% month-over-month but nobody was stocking up
- Customer churn was accelerating in the Bandung region — an early warning that would have been invisible in monthly reports
The Alert System
The most valuable feature isn't the dashboard itself — it's the automated alert system:
- Critical alerts via WhatsApp (using Go + WhatsApp Business API)
- Daily summary via email with AI-generated insights
- Weekly deep-dive report with trend analysis and predictions
One client told me: "For the first time, I get informed about problems before my managers do. That's worth more than any dashboard."
Budget-Friendly Options
You don't need a Rp 500 juta enterprise BI platform. Here's what works for most Indonesian SMEs:
- Basic setup: Free PostgreSQL + Grafana (Rp 0/month for software, Rp 500K for VPS)
- Mid-tier: Add AI insights layer with LLM API calls (Rp 500K-2M/month total)
- Full stack: Custom dashboard + AI engine + alert system (Rp 3-5M/month)
All of these are a fraction of what enterprise BI tools cost, and they're tailored to your specific business needs.
The Takeaway
A dashboard should be a decision-making tool, not a data graveyard. AI makes the difference between a chart you glance at and an intelligence system that drives your business forward.
Start with the questions your business actually needs answered. Build the AI layer to answer them automatically. Then let the dashboard display the answers, not just the data.